World Casino Directory Global Gaming Summary 2019
We've been following global gambling trends worldwide for nearly two decades here, and one observation we can make from the numbers over the years is that gambling is a very important industry with no end in sight to its growth.
On these pages, we'll look at where the industry has been since our first full year of operations in 2003, where it is now, and where it may be heading. Readers of World Casino News may find they already know much of this information as we report and publish for the industry as well as for players. The information presented here will be a mix of the dry numbers using broad and finite strokes, trends and trajectories, and a bit of casual analysis based on empirical facts.
Some global data is courtesy of H2 Gambling Capital, while regional data is often sourced from regulatory agencies. Company financial statements provide additional information along with university research. All revenues are reported in USD except where noted. All land-based casinos are considered "white" area operations. Online numbers refer to operators licensed in the place of play (white, e.g. UK) or with sufficient international regulation (grey, e.g. Malta). We have not compiled any statistics on dark grey operators (e.g. Curacao licensed casinos serving the USA or Australia, etc.), or black area operations (no license or otherwise illegal). Many global FY2018 numbers are projected (P) as not all operator's financial statements have been audited as of review time. The numbers should remain very close post-audit. FY2019 and beyond are Estimated (e).
- What the global numbers are
- Where most of the dollars turn over
- Who the biggest players are
Global Gaming Revenues 2019
The projected worldwide gross gaming win [GGW (player losses)] for all included metrics was US$448 billion in 2018 with more than $50b of that occurring in the interactive space. This grand market total includes landbased as well as onshore and offshore interactive:
- Race and sports betting
- Casino tables
- Gaming machines
- Bingo
- Lotteries
While racing fell as far as landbased bets, GGW actually rose overall thanks to stronger interactive betting worldwide, with significantly less growth expected in FY2019. Landbased sportsbetting increased from $38.3b to about $44b while the onshore and offshore interactive element pushed the total numbers to $69.6b. Overall, interactive onshore betting (simulcasts, OTB, etc.) continued to outstrip interactive offshore betting by a margin of about 1.5/1. We'll break out the new US betting numbers in another section and provide some background on two very important US law interpretations that will affect the numbers going forward - one for the better and one for the worse.
PASPA New DOJ opinionLandbased casino gaming
Like all other areas, this metric saw continued growth through 2018 with interactive games in casinos raking in $13.45b.
Mobile maintained its steady climb to take a 41.4% bite off all interactive gaming wins.
Global Gaming gross win 2003 - 2015 (billions USD)
500
400
300
200
100
0
Interactive poker remained mostly flat with a slight drop from 2,688.1m to 2,679.3m and bingo rose slightly, as it has since 2003 with a 15-year increase of more than thirteen-fold from $148m to $1.96b.
Thanks to Macau and other jurisdictions where casino gambling remains more popular than slots, tables still rule supreme as revenue generators picking up a little more than $8b more year on year at $138b compared $93.4b for gaming machines.
Interactive tables vs casinos
Interactive numbers are not as easy to break out as gaming machine revenues are only counted separately for landbased operations, whereas they are consolidated with table numbers for all interactive gaming.The Top Casino Countries in the World
| Rank | Nation | Gross Win (US$bn) | % of Global Total | Cum % of Global Total |
|---|---|---|---|---|
| 1 | United States | 113.65 | 25.2% | 25.2% |
| 2 | China (Inc SARs) | 80.91 | 17.9% | 43.1% |
| 3 | Japan | 47.27 | 10.5% | 53.6% |
| 4 | Italy | 21.47 | 4.8% | 58.3% |
| 5 | United Kingdom | 18.87 | 4.2% | 62.5% |
| 6 | Australia | 17.71 | 3.9% | 66.4% |
| 7 | Germany | 16.39 | 3.6% | 70.1% |
| 8 | Canada | 12.59 | 2.8% | 72.9% |
| 9 | France | 12.16 | 2.7% | 75.6% |
| 10 | South Korea | 10.74 | 2.4% | 77.9% |
Landbased
Once again, we see the United States, China (including special administrative units Macau, HK, etc), and Japan leading the pack of the top 30 gambling countries when only looking at land-based revenues. Combined, the three countries account for nearly sixty percent (56.8%) of all landbased revenues at footfall casinos.
While Macau continues to beat out the Las Vegas Strip, as it has since 2006/7, China itself simply can't compete with the overwhelming number of casinos in the United States - each generating its own numbers. We count nearly 2,000 licensed casinos in America between tribal enterprises and 48 of 50 states offering nearly a million slot machines and over 25,000 gaming tables.
Interactive
In the interactive sphere, we once again see Japan in the top three of thirty charted countries with roughly the same revenues as China is posting at just under 10% of global GGR each. Taken with the leader, the United Kingdom which represents 16.7% of legal worldwide revenues at $8.06b, the top 3 command a cumulative total of 36.3% of global interactive gambling by player location.
United States Gambling Summary
All land-based gambling metrics in the United States saw an increase in 2018 with the biggest jump, by percentage, being sportsbetting with a projected 2018 GGW of about $332m compared to $203m in 2017 - or more than a 63% uptick.
Accounting for the increase was a May 2018 US Supreme Court ruling which deemed the federal ban on sportsbetting unconstitutional.
For more on what that means to the industry please see What the Demise of PASPA Means.
Since that analysis was written, the US Department of Justice has reversed an Obama era decision which allowed online gambling, at least within a state's borders. It's unclear what effect that decision will have on interactive numbers, but don't expect the operators who invested heavily in the US market to go quietly or without a fight. Total land-based gaming in the US, including bingo and Class III machines on tribal lands, accounted for about $80b of the US total with lotteries raking in another nearly $29b. Native American casinos generated slightly more revenue in the US than did the commercial casinos, as they have since they first reached that milestone in FY2016.
China Gambling Summary
We'll restrict the numbers here to Macau, rather than analyzing the elements such as lottery in China - except to note that inside China proper, and not the SARs, lotteries are the drivers of most revenue in the highly regulated country.
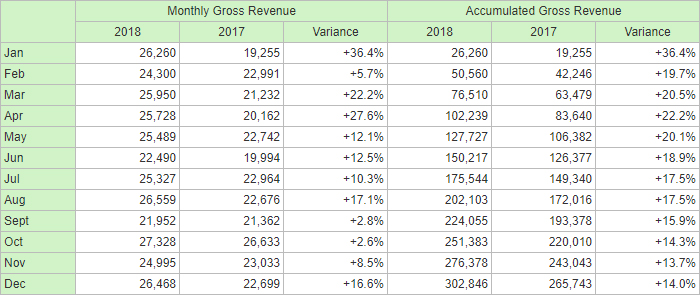
Macau continued its remarkable recovery with some months contributing more to the y-o-y increase than others.
January showed the greatest variance with gross revenues jumping 36.4% over the previous year. The worst month was
October at 2.6% better which only brought the cumulative positive variance down to 13.7% for November.
The SAR ended the year with a positive 14% cumulative growth in GGR for December 2018.
Let's take another look at Japan!
If the only thing we learn by reading the news about gambling in Japan is that the number of pachinko parlors has been on the decline for several decades, that citizens enjoy horseracing, and that the government and social leaders have been struggling with the question of introducing integrated resorts (IRs) - we may be overlooking the fact that gambling is intrinsic to some parts of Japanese culture and society.
In 2018, Japanese punters bet a total of US$30.3b on horse racing alone. Some 3,380 billion Yen. They ponied up about a third of that again on sportsbetting (a perennially falling number). But it's the pachinko machines that created wealth for the Okadas and other gaming entrepreneurs there, legally.
The gross gambling turnover on gaming machines in Japan was US$180.9b in 2018.
With the IRs that could potentially come into place in the near future, the new action could generate a gross win of $10bn in the first full year of operations and grow that number by 50% by the fifth year to $15bn.
As the negotiations and infighting settle out, we'll eventually know the number of new properties as well as the size, type, and location of each - all factors in the final numbers.
Which countries play online the most?
We need to look to the Nordics to see which major nations represent the most active online gamblers.
Sweden, which instituted a new legal framework for all gambling, including interactive, on January 1, 2019, edges out number two Denmark as well as Norway. Nearly half of all gambling done in these Nordic countries is interactive.
The top three are followed by:
- 4 Russia 45.4%
- 5 Iceland 43.8%
- 6 Finland 43.1%
- 7 United Kingdom 42.7%
- 8 Georgia 38.8%
- 9 Slovak Republic 34.8%
- 10 Algeria 33.9%
Who spends the most on Gambling?
Australia continues to be the gambling leader when it comes to the amount spent each year per capita. Adjusted to US$, each adult down under spent an average of $934 in 2018. Singapore clocked in a spend of $722 with Finland rounding out the top 3 by leaving $508 per person on the tables and in the machines whether virtual or mechanical.
While there may be more casinos in the USA than anywhere else, Americans spent about half of what Australians did, on average, again last year. Rounding out the top ten per person revenue generators for casinos in 2018 we find:
- 4 New Zealand $461
- 5 United States $427
- 6 Japan $444
- 7 Ireland $428
- 8 Italy $426
- 9 Norway $391
- 10 Canada $362
Chart of top casino companies worldwide in 2019, by revenue (billions USD)
International acceptable accounting practices have recently changed with some companies using newer methods sooner than others. While there may be slight deviations this year, after Fiscal Year 2019 all of them should be homogenized and directly comparable. If discrepancies arise we will weight future numbers and provide an explanation as such.
In the past, we listed the top 12 companies. However, mergers, acquisitions, and divestments have reduced our list to the top 11. The former Melco Crown Entertainment is now two separate casino companies: Melco Entertainment Resorts and Crown Resorts. Pinnacle is now part of Penn National Gaming.
Caesars, MGM, and Penn have also taken advantage of real estate investment trust (REIT) vehicles in order to lease 'their own' properties back to themselves, which has changed the companies' profits, earnings, and debt loads more than it has changed revenues - if at all. But those transitions should be mentioned as they have occurred since our last report.
Summary Land Based Data (US$m)
125.000
100.000
75.000
50.000
25.000
0
- 1. Horserace
- 2. Sports
- 3. Total Beting
- 4. Casino
- 5. Gaming Machines
- 6. Bingo/Other
- 7. Total Gaming
- 8. Lotteries
- 9. Total Gabling